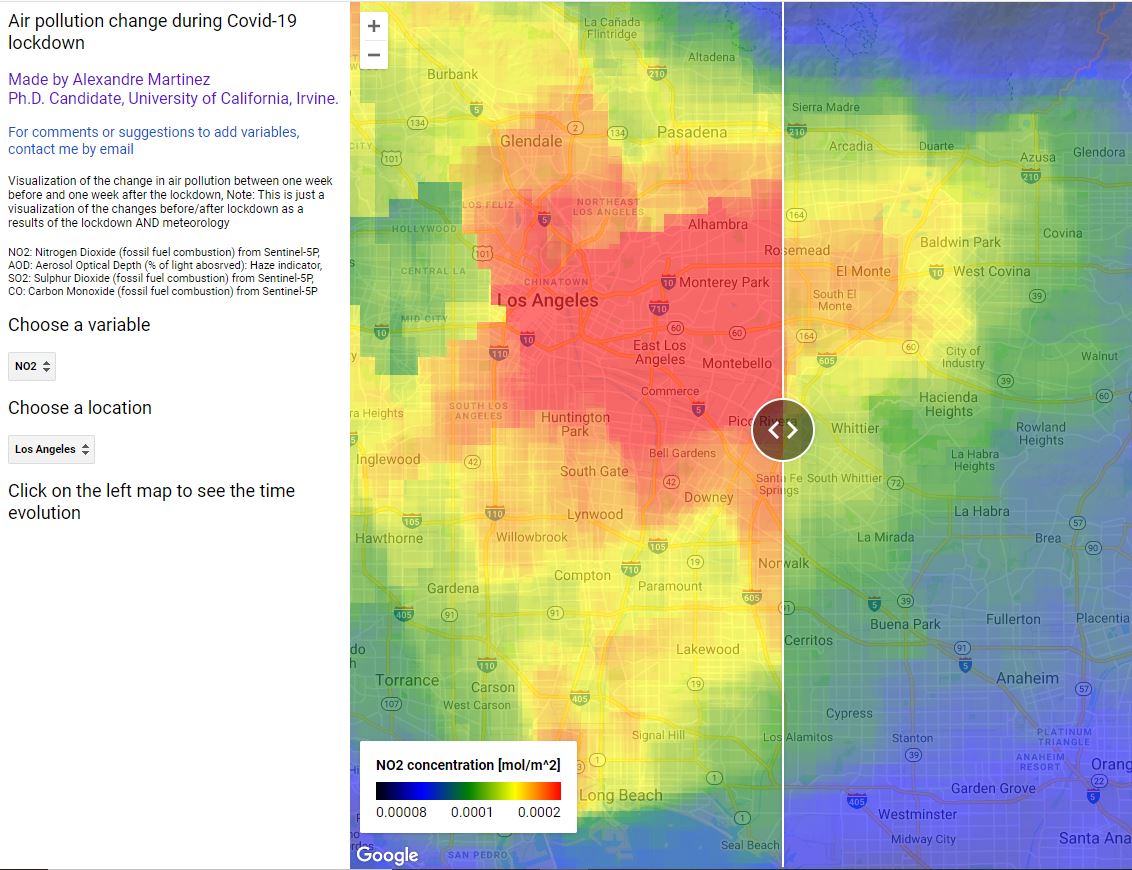
I have developped an application base on Google Earth Engine and satellite data to visualize the impact of Covid19 lockdowns on air quality. Here an example in Los Angeles, with a significant decrease a day after the lockdown, and a consistent increase again after a month or so. I added more locations with their lockdown dates and more variables.
Posted inIn the News
Air pollution change during Covid-19 lockdown
Post navigation
Previous Post
 Alexandre Martinez awarded the 2020 New Faces of Civil Engineering – Professional Edition Award by the ASCE!
Next Post
Wildfire VR