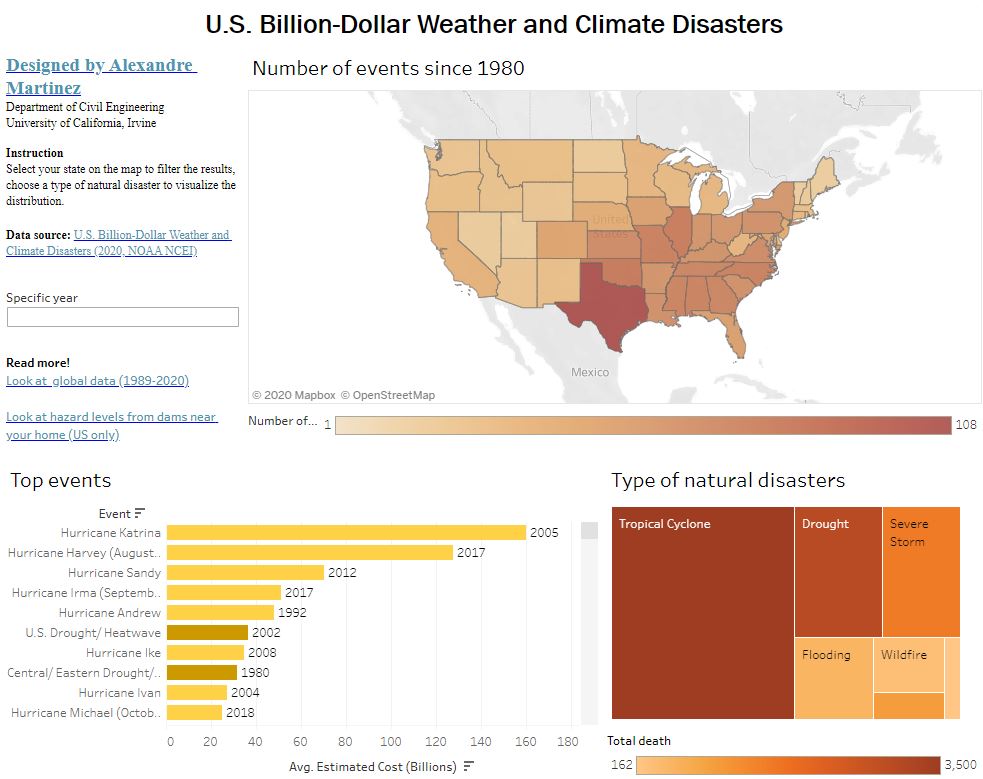
We tought a workshop on data visualization for journalism at UC Berkeley with a live demonstration on natural disasters in the USA.
At first, people we asked the participants to look at the NOAA website on natural disasters and asked them to find the costliest category for a few states. Then, we show how interative data visualization on Tableau is making it much easier and faster to answer this type of question.
Here is the final product the attendants ended up with.